results
Construction output rose 0.8% in September 2026 after three monthly falls, ONS data shows
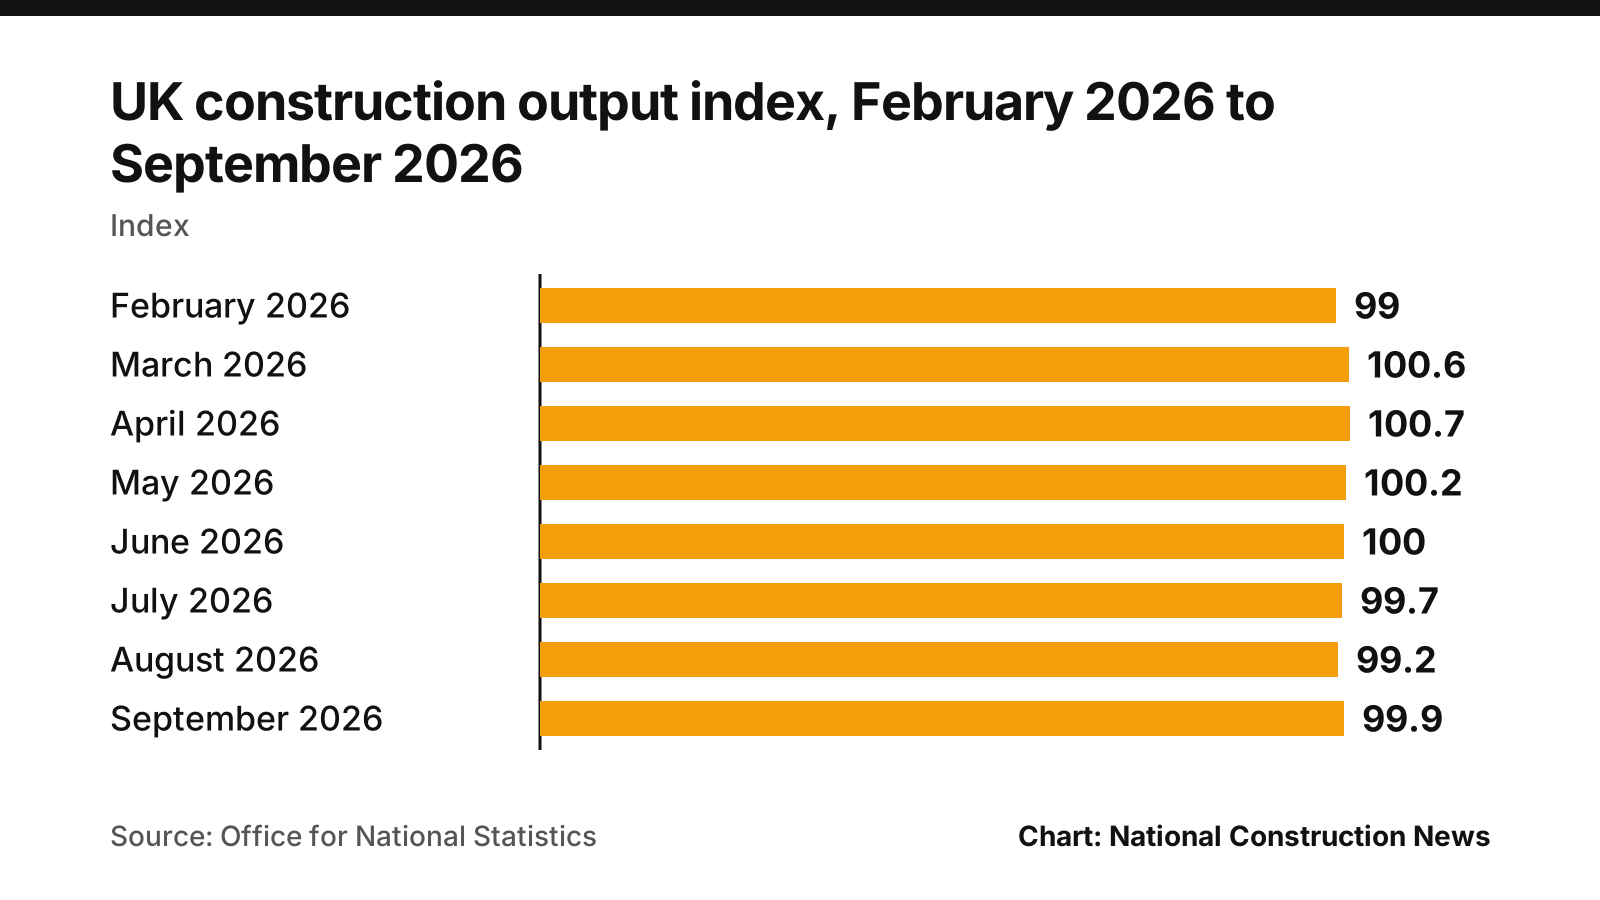
Office for National Statistics figures put the UK construction output index at 99.9 in September 2026, up on August but 1.5% below a year earlier, while vacancies fell to 27,000.

UK construction output rose 0.8% in September 2026 compared with the month before, according to the Office for National Statistics (ONS), the first monthly increase since a run of three consecutive falls over the summer.
The ONS construction output index stood at 99.9 in September 2026, up from 99.2 in August 2026. The index is a chained volume measure, seasonally adjusted, and forms part of the ONS monthly estimate of UK gross domestic product (GDP).
The September figure was published on 12 November 2026. Despite the monthly rise, the index remained below its level of a year earlier: in September 2025 it was 101.4, which puts September 2026 output 1.5% lower on the year, a percentage calculated from the published index values.
The monthly picture
The 0.8% rise in September followed declines in each of the three previous months. Output fell 0.3% in June 2026, 0.2% in July 2026 and 0.5% in August 2026, according to the ONS monthly GDP estimate.
The highest reading of the index in the past 36 months was 101.6, most recently recorded in April 2025.
Vacancies and pay
Separate ONS labour market data put the number of job vacancies in UK construction at an estimated 27,000 in July to September 2026. That compares with 30,000 in July to September 2025. The figure is a three-month average.
Average weekly earnings in construction were £818 in August 2026, on the ONS measure of total pay excluding arrears, seasonally adjusted. A year earlier, in August 2025, the figure was £810. The ONS puts annual growth in construction total pay at 1.0% for August 2026, on a single-month, seasonally adjusted basis.
Material prices
Producer prices for construction materials continued to rise over the year. The ONS producer price index for concrete products for construction, which measures output sold on the domestic market with 2015 set at 100, reached 197.7 in September 2026, compared with 191.2 in September 2025. That is a rise of 3.4% over the year, calculated from the published index.
The equivalent index for bricks, tiles and clay construction products stood at 189.9 in September 2026, up from 181.9 in September 2025, a rise of 4.4% over the year on the same basis.
The table below sets out the latest figure, the comparable figure a year earlier and the change for each measure.
What happens next
The next ONS monthly GDP estimate, which will include the construction output figure for October 2026, is due on 11 December 2026.
UK construction in numbers: latest official figures
| Measure | Latest | Period | A year earlier | Change |
|---|---|---|---|---|
| Construction output index | 99.9 | September 2026 | 101.4 | -1.5% |
| Output growth on the previous month | 0.8% | September 2026 | 0.4% | |
| Job vacancies in construction | 27,000 | July to September 2026 | 30,000 | -3,000 |
| Average weekly earnings in construction | £818 | August 2026 | £810 | +1.0% |
| Price index: concrete products for construction | 197.7 | September 2026 | 191.2 | +3.4% |
| Price index: bricks, tiles and clay construction products | 189.9 | September 2026 | 181.9 | +4.4% |
How the figures were compiled
All figures come from ONS time series published on ons.gov.uk under the Open Government Licence v3.0, series ECY9, ECZE, JP9L, K5CD, K5CE, EW6K and EW6C. Monthly growth, vacancies, earnings, annual pay growth and the price indices are quoted exactly as the ONS publishes them, while the annual changes in the output index and the price indices were calculated from the published index values and rounded to one decimal place. The series are published on different dates, so the latest period differs between measures, and the ONS notes that growth rates taken from the output index may differ slightly, because of rounding, from those in its Construction Output in Great Britain release. Official statistics are revised, and earlier figures are as currently published.
Sources
- Office for National Statistics (series ECY9) (opens in a new tab) (accessed 2026-11-12)
- Office for National Statistics (series ECZE) (opens in a new tab) (accessed 2026-11-12)
- Office for National Statistics (series JP9L) (opens in a new tab) (accessed 2026-11-12)
- Office for National Statistics (series K5CD) (opens in a new tab) (accessed 2026-11-12)
- Office for National Statistics (series K5CE) (opens in a new tab) (accessed 2026-11-12)
- Office for National Statistics (series EW6K) (opens in a new tab) (accessed 2026-11-12)
- Office for National Statistics (series EW6C) (opens in a new tab) (accessed 2026-11-12)
This story was researched from the primary sources above and checked against them before publication. Spotted an error? Tell us and we will correct it promptly.