Data tracker
Construction output in numbers
The official monthly measure of UK construction output, with vacancies, pay and materials price indices for the industry, from Office for National Statistics time series.
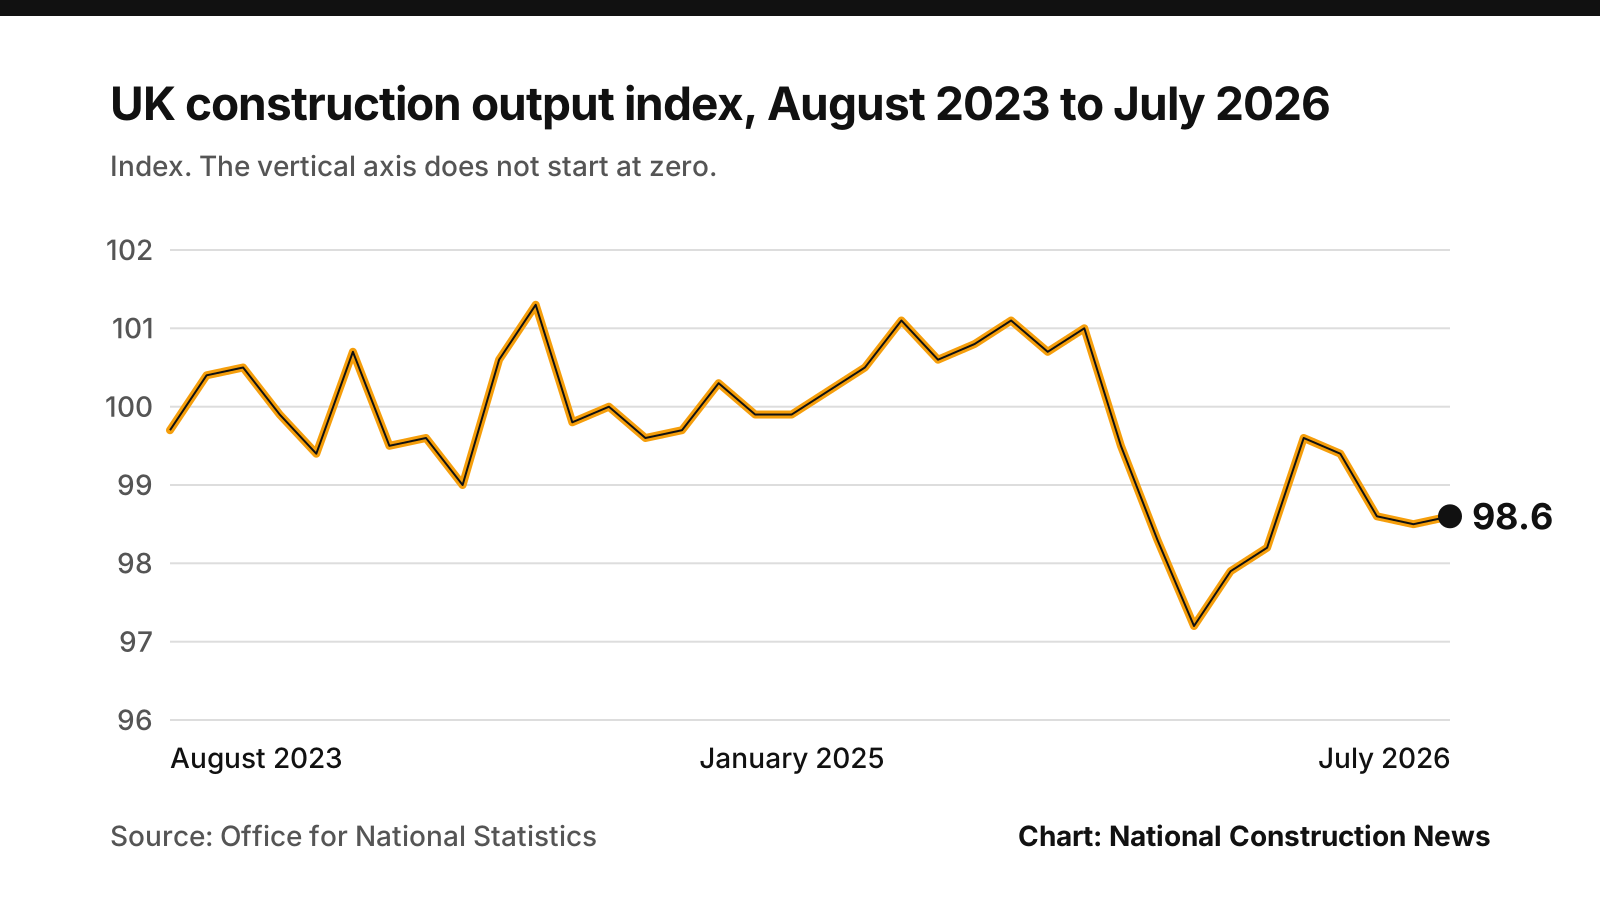
What the figures show
- The Office for National Statistics construction output index for the UK stood at 98.6 in July 2026, compared with 98.5 in June 2026. The index is a chained volume measure, seasonally adjusted, published with the ONS monthly estimate of UK GDP.
- In July 2025 the index was 101.1, so construction output in July 2026 was down 2.5% on a year earlier. That percentage is calculated here from the published index, which is rounded to one decimal place.
- The highest reading of the index in the past 36 months was 101.3, most recently in June 2024.
- The July 2026 output figure was published on 11 September 2026. The next monthly GDP estimate is due on 15 October 2026.
- The ONS notes that growth rates calculated from this index may differ slightly, because of rounding, from those in its Construction Output in Great Britain release.
| Measure | Latest | Period | A year earlier | Change |
|---|---|---|---|---|
| Construction output index | 98.6 | July 2026 | 101.1 | -2.5% |
| Output growth on the previous month | 0.1% | July 2026 | 0.3% | |
| Job vacancies in construction | 29,000 | June to August 2026 | 31,000 | -2,000 |
| Average weekly earnings in construction | £819 | July 2026 | £812 | +0.9% |
| Price index: concrete products for construction | 196.1 | August 2026 | 193.2 | +1.5% |
| Price index: bricks, tiles and clay construction products | 190.4 | August 2026 | 184.4 | +3.3% |
| Month | Index | Growth on previous month |
|---|---|---|
| August 2025 | 100.7 | -0.5% |
| September 2025 | 101.0 | 0.3% |
| October 2025 | 99.5 | -1.5% |
| November 2025 | 98.3 | -1.2% |
| December 2025 | 97.2 | -1.1% |
| January 2026 | 97.9 | 0.7% |
| February 2026 | 98.2 | 0.3% |
| March 2026 | 99.6 | 1.4% |
| April 2026 | 99.4 | -0.1% |
| May 2026 | 98.6 | -0.8% |
| June 2026 | 98.5 | -0.1% |
| July 2026 | 98.6 | 0.1% |
How the figures are compiled
Every figure on this page is calculated by our own code from the official data. No figure is produced or altered by a language model.
- Source: Office for National Statistics time series, read from the JSON published alongside each series on ons.gov.uk under the Open Government Licence v3.0. The series identifiers are ECY9, ECZE, JP9L, K5CD, K5CE, EW6K, EW6C.
- Construction output is the construction index within the ONS monthly estimate of UK GDP: a chained volume measure, seasonally adjusted. The ONS notes that growth rates calculated from this index may differ slightly, because of rounding, from those in its Construction Output in Great Britain release.
- Monthly growth, vacancies, earnings, annual pay growth and the price indices are quoted exactly as the ONS publishes them. Changes over a year in the output index and in the price indices are calculated here from the published index values and rounded to one decimal place.
- Vacancies are a three-month average in thousands. Earnings are the ONS average weekly earnings series for total pay excluding arrears, seasonally adjusted. Price indices are the ONS producer price indices for output sold on the domestic market, with 2015 = 100.
- The series are published on different dates, so the latest period differs between measures; each figure is labelled with its own period. Official statistics are revised, and earlier figures here are as currently published.
Source and licence
Data: ONS time series (monthly GDP, labour market and producer price datasets), Office for National Statistics. Contains public sector information licensed under the Open Government Licence v3.0.
Official records quoted above:
- ONS time series ECZE: Construction output, growth on the previous month (%)
- ONS time series JP9L: UK job vacancies in construction (thousands, three-month average)
- ONS time series K5CD: Average weekly earnings in construction, total pay excluding arrears, seasonally adjusted (£)
- ONS time series K5CE: Average weekly earnings in construction, total pay, growth on the same month a year earlier (%)
- ONS time series EW6K: Producer price index: concrete products for construction purposes (2015 = 100)
- ONS time series EW6C: Producer price index: bricks, tiles and construction products in baked clay (2015 = 100)
Spotted an error? Tell us and we will correct it promptly.